SaaS and Custom Software
Data & Analytics
Turn Raw Data Into Decisions People Actually Act On
Dashboards, reporting pipelines and data infrastructure that convert scattered business data into something a team can actually use - not a data warehouse nobody logs into. We design around the decisions your business needs to make, then build the pipeline to support them.
9
real SaaS and Custom Software projects
★
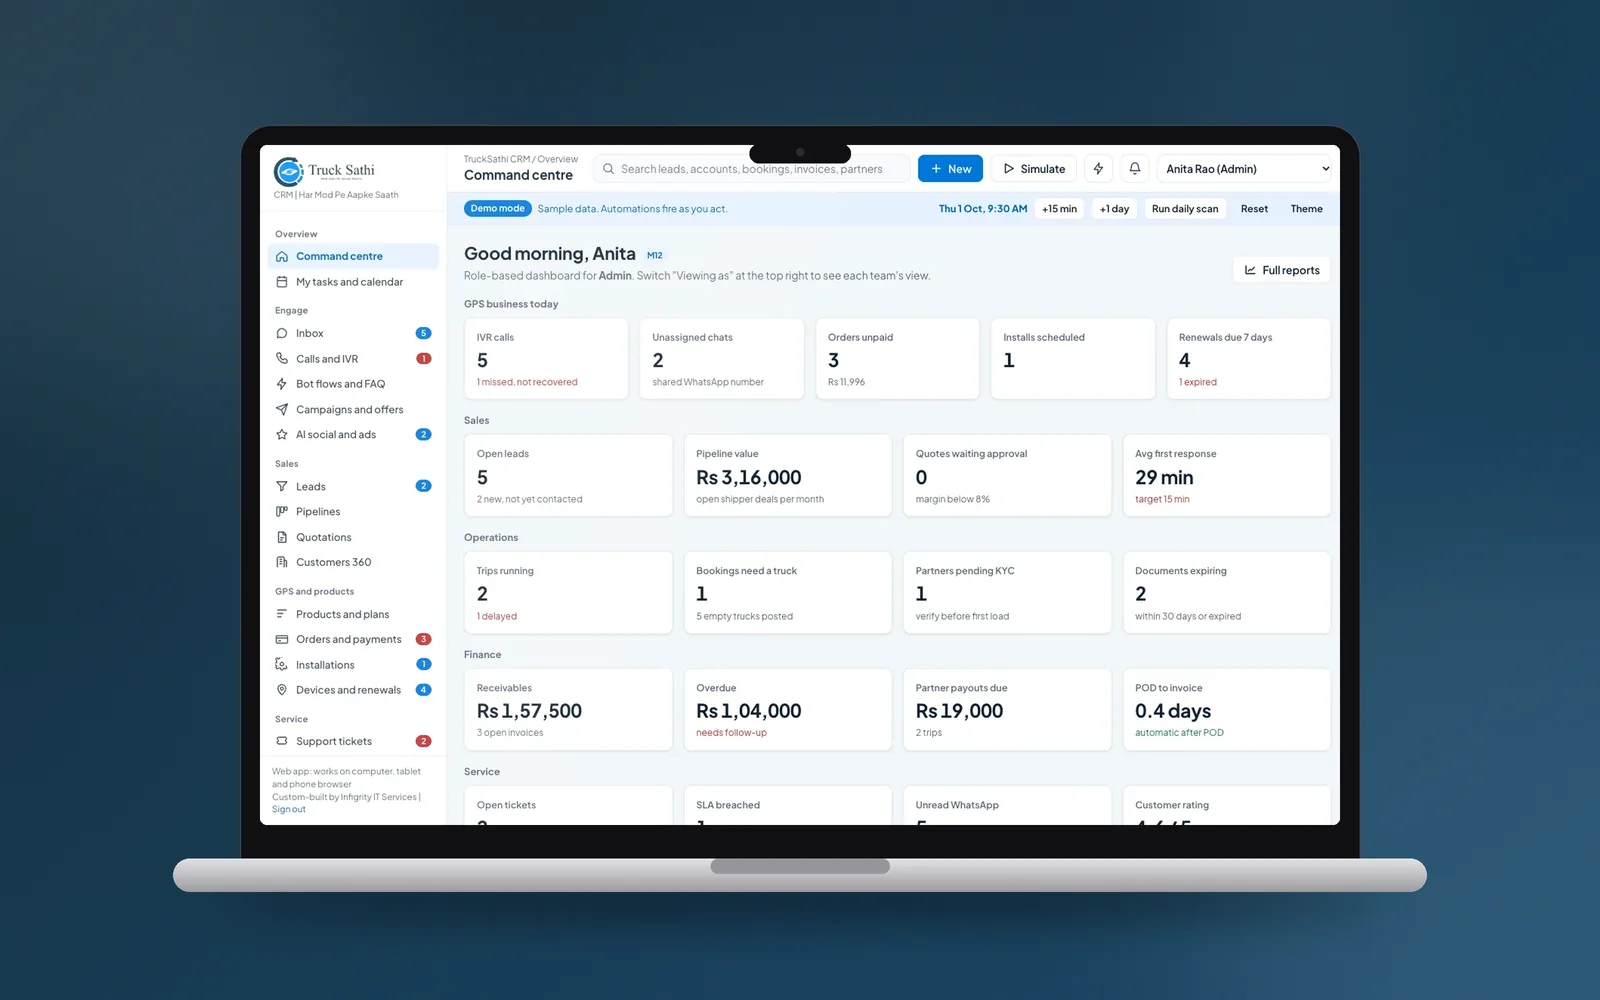
Truck Sathi CRM: live since November 2026
Fixed
scope, price and milestones before work starts
Yours
code, designs, data and accounts from day one
Is Data & Analytics right for you?
You need a data analytics build when the answers to your questions sit across several tools and someone is combining them by hand in spreadsheets. If your only question is how your website and campaigns perform, a properly configured marketing analytics setup may be enough.
A good fit if
- Sales, finance, marketing and operations data live in separate systems
- Different teams report different numbers for the same metric
- Someone spends hours each week building the same report
- You want forecasting or AI later and need clean data first
Something else may suit you better if
Plan for
- Agree on one definition for each key metric, such as revenue or active customer, before anything is built.
- Name an owner for each data source, because reports break when someone changes a source system without warning.
- Personal data needs access controls and retention rules from the start, not after launch.
What is included?
- 01
Data Pipeline Design
Connecting your product, CRM and operational systems into one reliable pipeline.
- 02
Dashboards & Reporting
Reporting built around the metrics your team actually reviews, not a generic template.
- 03
Data Warehousing
Structured, query-ready data infrastructure and modeling.
- 04
Attribution Reporting
Performance reporting tied to real business outcomes, not vanity metrics.
Why Infigrity for Data & Analytics?
Starts With Your Highest-Value Sources
Most engagements connect 2-3 highest-value data sources first, rather than trying to unify everything on day one.
Dashboards Your Team Actually Opens
We build the reporting layer people use, not just the pipeline behind it - a pipeline nobody looks at isn't worth building.
Works With Your Existing BI Tool
We connect the pipeline to whatever BI tool your team already prefers - Power BI, Looker, Tableau, or a custom dashboard.
Documented for Your Team to Extend
Documentation so your team can add new reports without coming back to us for every small change.
Data & Analytics work
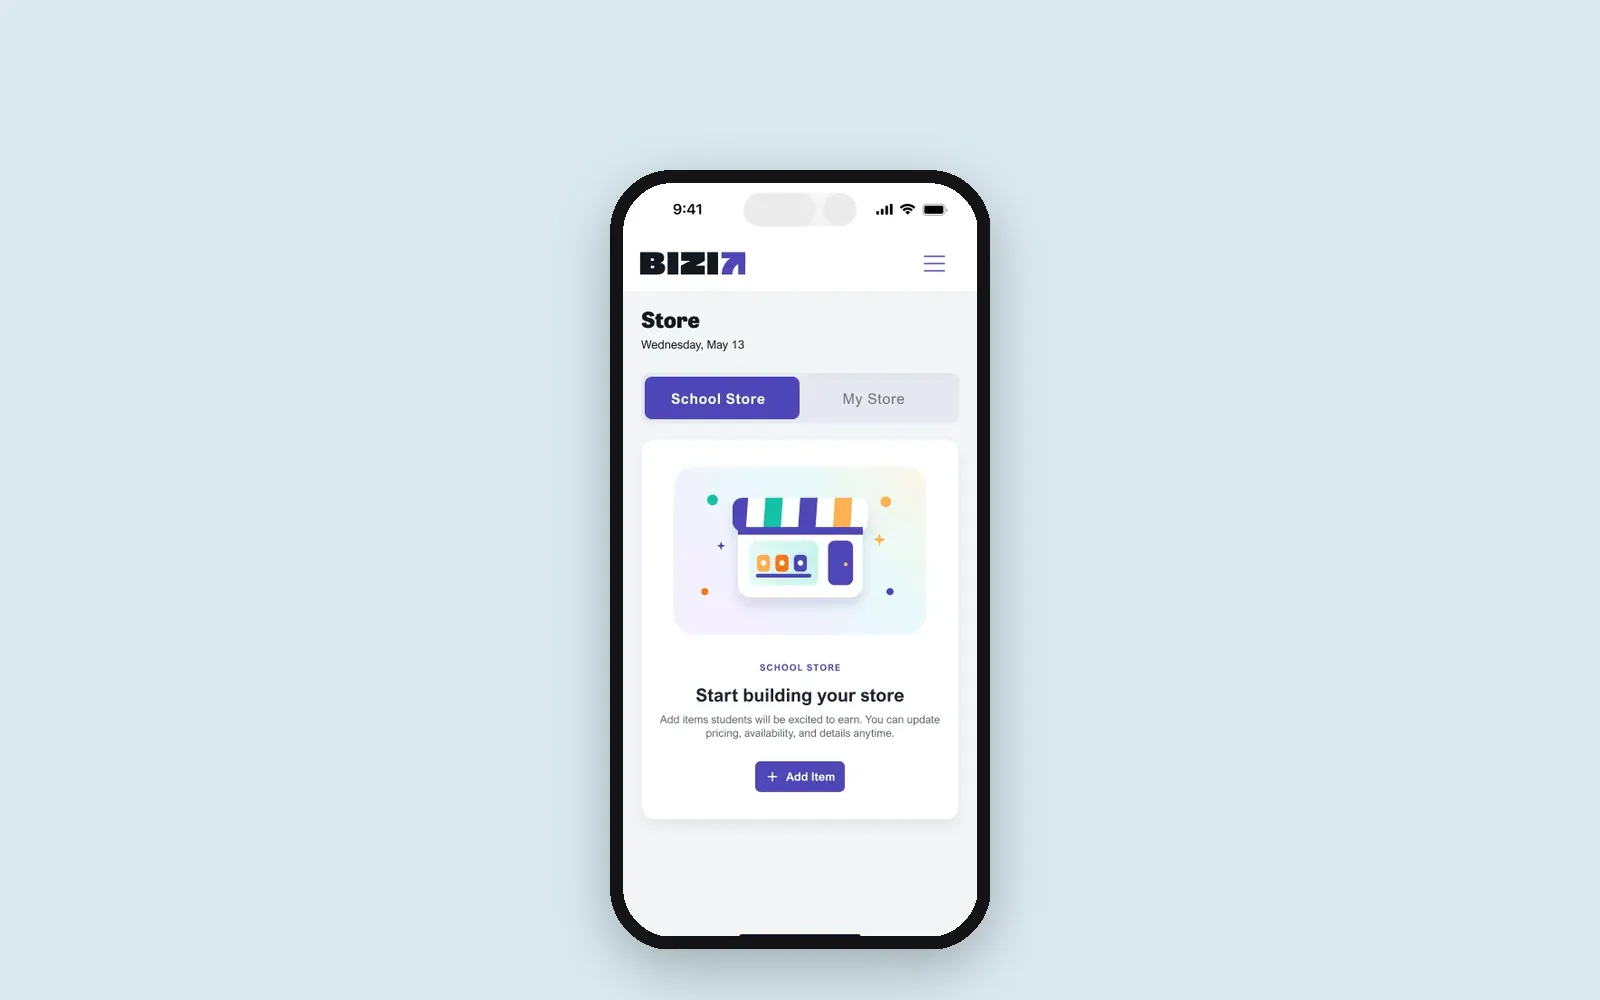 Live on App Store and Google Play
Education · United States
Bizi: a classroom rewards app for US schools, live on iOS and Android
- Flutter
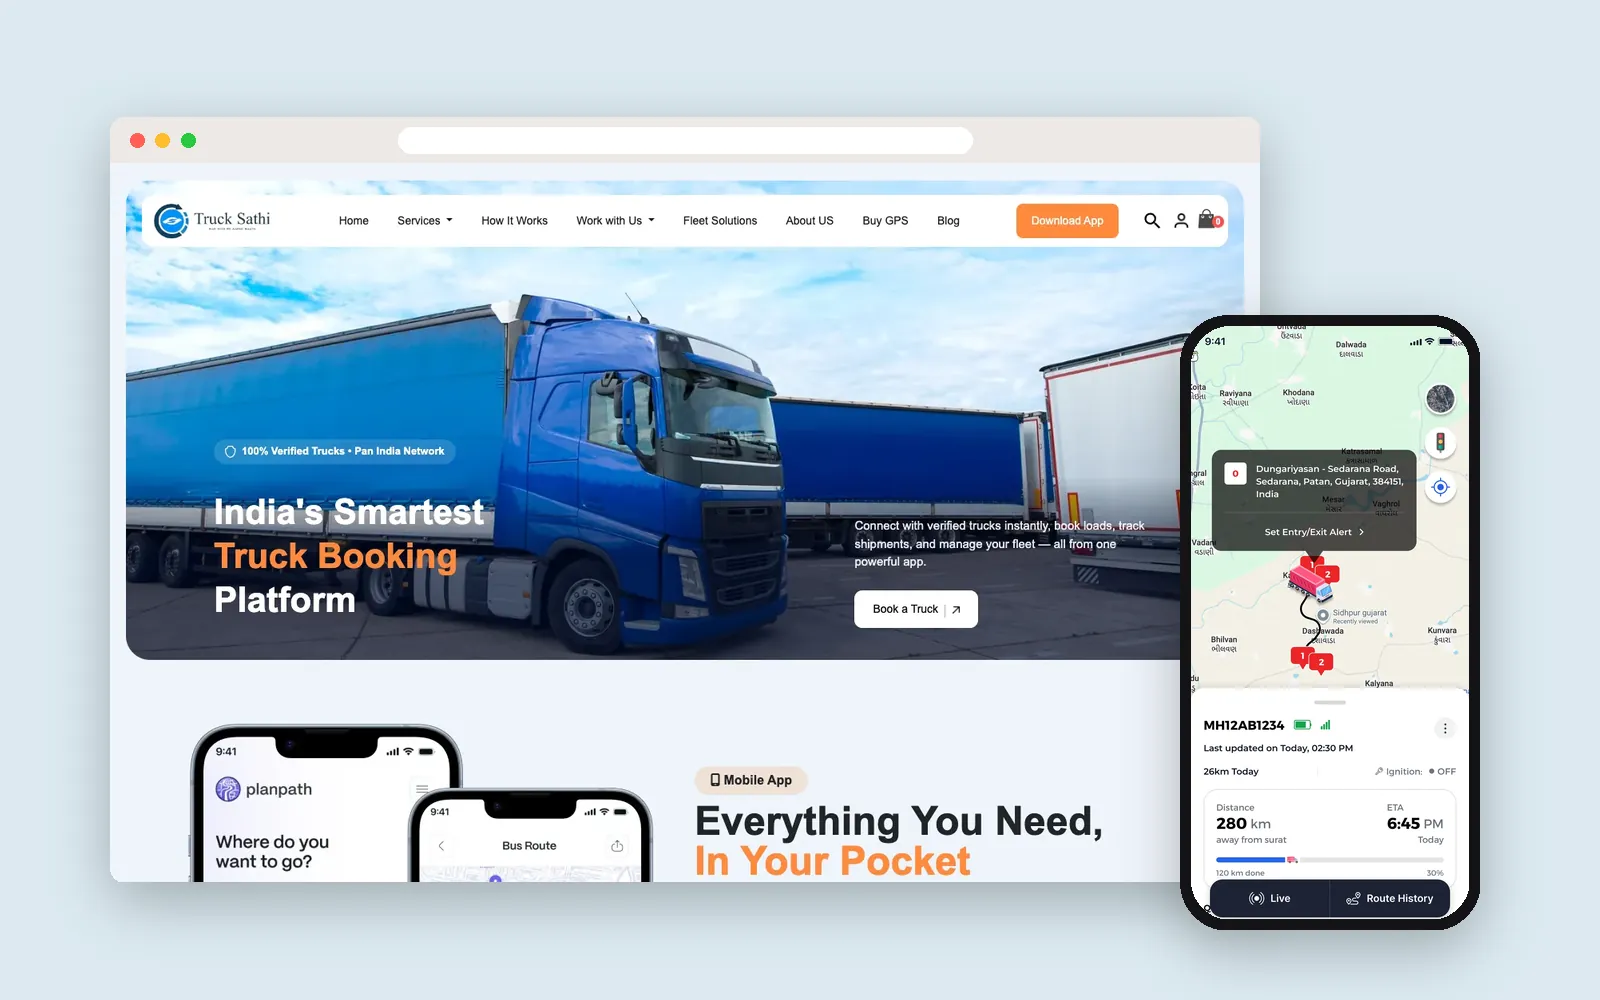 Live on Google Play
Logistics · India
Truck Sathi: truck booking, live GPS tracking and a custom CRM in 8 Indian languages
- Flutter
- WooCommerce
- WordPress
- Laravel
- Next.js
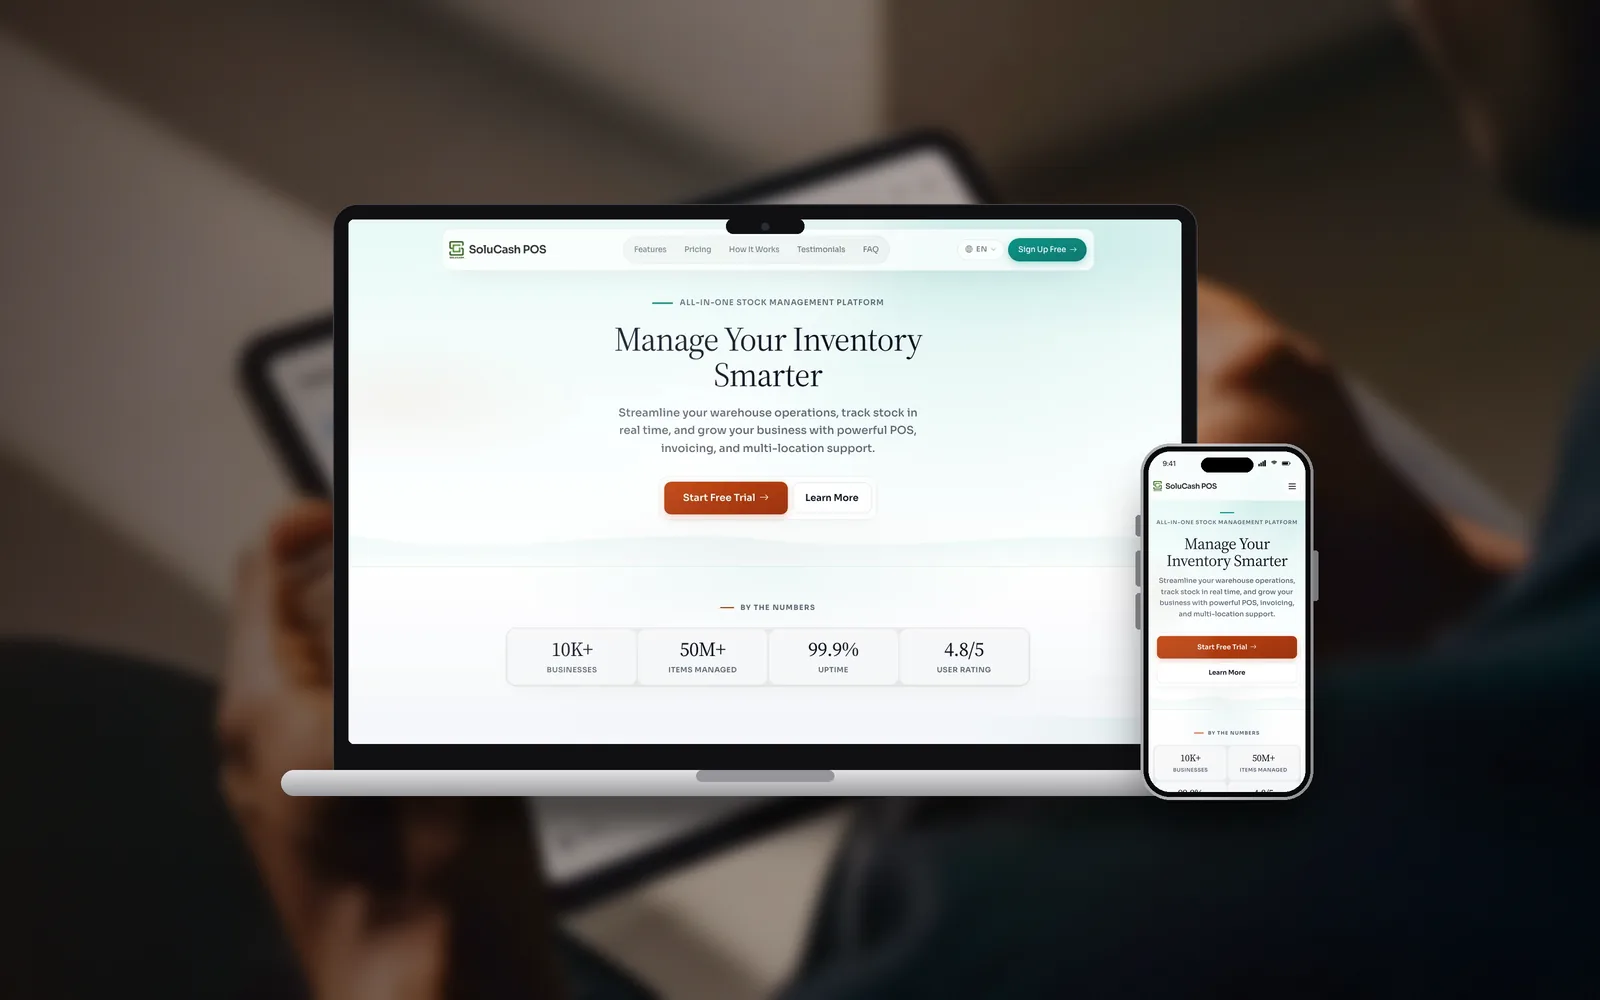
Technology & SaaS
SoluCash: a point-of-sale and business platform for companies across Africa
Data scattered across five different tools with nobody trusting any of it? Let's connect it.
Get a fixed quote and clear milestones after a free call.
How we deliver Data & Analytics
- 1
Metrics Discovery
Identifying which decisions your team makes regularly, and what data those decisions actually need.
- 2
Data Audit
Mapping where your data currently lives and how clean or fragmented it is.
- 3
Pipeline & Warehouse
Building the pipeline and data model that gets data from source systems into one reliable place.
- 4
Dashboard Build
Reporting built around the metrics identified in discovery, not a generic template.
- 5
Handover & Training
Your team trained to read, extend and trust the dashboards going forward.
Ways to work with us
Time & Material
For a reporting setup that will keep growing as new data sources come online.
- Change scope as requirements evolve
- Pay based on work delivered
- Sprint-based delivery and review
- Full visibility into progress
Dedicated Team
Extend your team with data engineers who work inside your existing stack.
- Resourcing matched to your exact needs
- Direct daily collaboration with your team
- Scale the team up or down as needed
- Guaranteed committed hours
Fixed Price
For a clearly scoped pipeline and dashboard build with a defined timeline.
- Scope agreed upfront
- Milestone-based delivery
- Fixed timeline and budget
- Best for well-defined projects
Tools and technology
- Python
- PostgreSQL
- AWS
Frequently asked questions
We have data scattered across several tools - where do you start?
With an audit of what you have and what decisions you're trying to make - most projects start by connecting 2 to 3 highest-value sources rather than trying to unify everything at once.
Do you build the dashboards, or just the data pipeline?
Both - a pipeline without a usable dashboard doesn't get looked at. We build the reporting layer your team will actually open, not just the infrastructure behind it.
How is this different from just using Google Analytics?
Off-the-shelf analytics tools cover web traffic well but rarely combine it with your CRM, sales or operational data - this service builds the layer that connects all of it into one view.
Can this integrate with our existing BI tool?
Yes - we typically build the pipeline and data model, then connect it to whatever BI tool (Power BI, Looker, Tableau, or a custom dashboard) your team already prefers.
More in SaaS and Custom Software
Often paired with
Ready to start your Data & Analytics project?
Tell us what you need. We reply within one business day with next steps, a rough timeline and the questions that matter.